Hi everyone, first of all: Happy New Year (within the Gregorian calendar). I hope you all had a nice restorative time during this small lecture break.
Here follows the blogpost describing the existing crying material I have selected:
589 Days of Crying by Robin Weis
For my PhD-research, I am exploring personal data, what they are, and what they mean to people. Part of my research is exploring how to move beyond our current understanding of (personal) data, which is often limited to easy to quantify activities and phenomena (e.g., step count and heart rate data), and explore how to incorporate qualitative experiences, as these are quintessential as to how we understand our worlds. With this lens and interest, I discovered the work of Robin Weis.
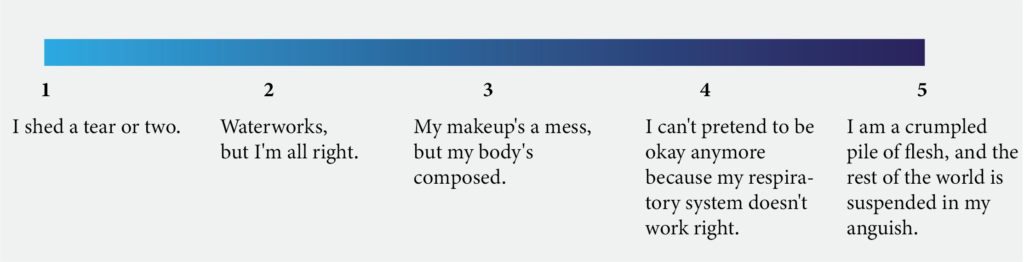
For personal reasons, Robin Weis started to track her cries, collect a database, and visualise this. This process required her to define what counts as a cry (“I defined a “cry” to begin once I shed a tear and end when I regained composure.”), distinguish between different types / intensities of crying (see Figure 1), and determine exclusion criteria (cries triggered by “sensational stimuli” such as allergies or laughter were not included). Within this frame, the date, time, intensity, location, and context of 589 days of crying were tracked and visualised, resulting in the following visualisation:
:format(webp):no_upscale()/cdn.vox-cdn.com/uploads/chorus_asset/file/6530893/crying_graphics_SANKEY_CHORD_CRIES__1_.0.png)
Personally, I like the decision to go with the parallel set plot. Although this is a traditional visualisation technique (of which could be argued that they do not offer the same depth and connection as other types of data representations, e.g. [1,2]), the flow of the chart reminds me of the flow of her tears—probably an intentional decision.
Interestingly, this datafication experience had both positive (e.g., “I came to terms with my dissonance about being strong and sensitive at the same time.”) and negative consequences (e.g., “It became a compulsion to check the time every time I started (and stopped) crying”). Robin Weis’ reflection on the process already gives insights in what it is like to data-fy such a personal (and sensitive) experience. However, for me, it also triggers questions. For example, what other aspects could have been tracked? And what about the vanity of crying (do you gave the feeling you need to stay composed or could you fully let go)?
Sources:
The original work and article can be found here: http://robinwe.is/explorations/cry.html . Together with the more elaborate article for vox.com (content warning, the article mentions a suicide attempt): https://www.vox.com/2016/5/25/11744768/crying-spreadsheet
All quotes are taken from the vox.com article, as it contained more elaborate descriptions.
Referenced papers:
[1] Dietmar Ofenhuber. 2020. What we talk about when we talk about data physicality. IEEE Computer Graphics and Applications 40, 6 (June 2020), 25–37. https://doi.org/10.1109/MCG.2020.3024146
[2] Rosa van Koningsbruggen and Eva Hornecker. 2021. “It’s Just a Graph” – The Effect of Post-Hoc Rationalisation on InfoVis Evaluation. In Creativity and Cognition (C&C ’21). Association for Computing Machinery, New York, NY, USA, Article 45, 1–10. https://doi.org/10.1145/3450741.3465257
One reply on “Datafication of Crying”
great read and what an amazing project. love that she cried because of bed bugs. been there.